BuddyPress Statistics v1.8.0: Finally Know Your Community’s True Health

You’ve invested countless hours building your BuddyPress or BuddyBoss community. Members are signing up. Activity is happening. But here’s the uncomfortable question: Do you actually know what’s happening inside your community?
The Blind Spot Every Community Manager Faces
Most community managers operate in the dark. They can see total member counts, maybe some basic activity numbers, but they’re missing the insights that matter. Which members are about to disappear? Who are your most valuable contributors? What content actually drives engagement? Without answers to these questions, you’re making decisions based on gut feeling rather than data.
WordPress doesn’t provide these analytics out of the box. BuddyPress doesn’t either. And that’s exactly why I built BuddyPress Statistics—and why version 1.8.0 represents a major leap forward in understanding your community’s health.
What You Can Actually DO With BuddyPress Statistics
Before diving into features, let me be clear about the value proposition. BuddyPress Statistics isn’t just about charts and numbers—it’s about actionable intelligence that helps you:
- Identify members slipping away before they’re gone forever
- Recognize your community champions who deserve recognition and rewards
- Track what content drives engagement so you can create more of it
- Export data for stakeholder reports with professional CSV exports
- Make data-driven decisions about community strategy and resource allocation
Every feature in this plugin was designed with one question in mind: “What will the community manager do with this information?” If there’s no clear action, the feature doesn’t belong.
NEW: Know Your Community’s Health at a Glance
The headline feature of v1.8.0 is the completely redesigned User Health Dashboard. This single screen answers the most important question any community manager can ask: “How healthy is my community right now?”
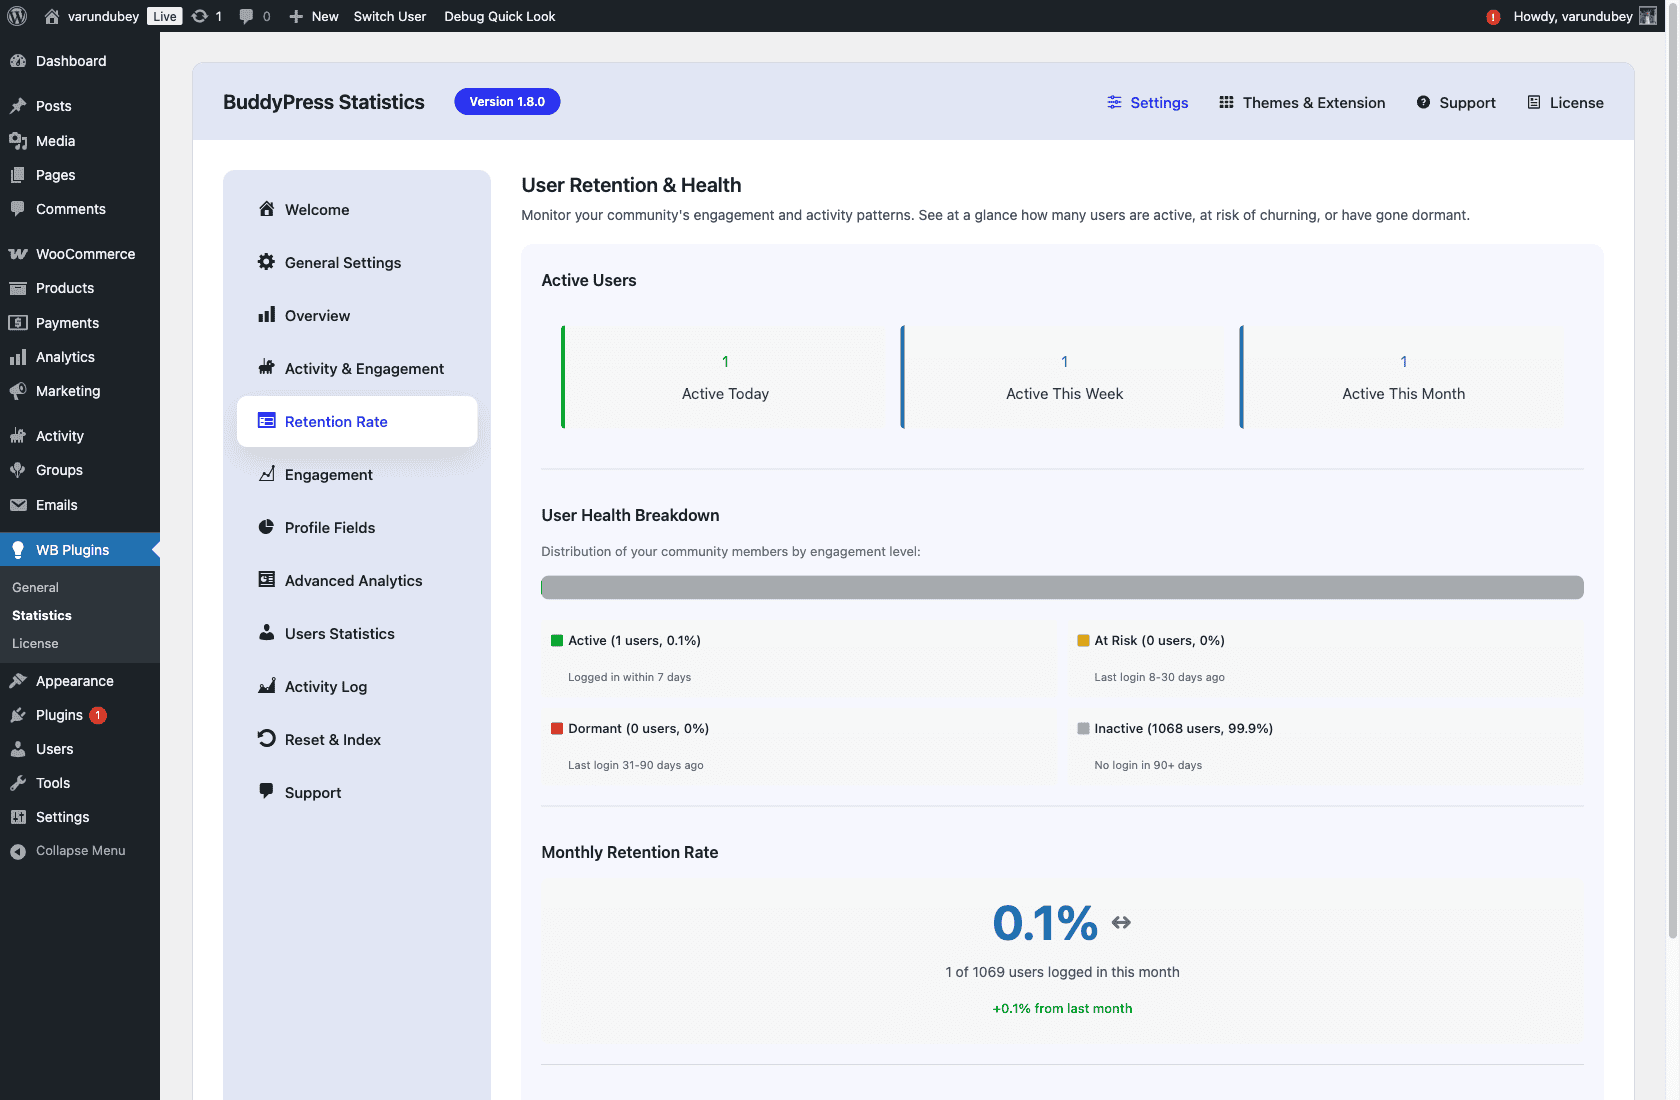
The dashboard segments your entire user base into four categories:
Active Members (Green)
These are your engaged community members—people who have logged in and participated recently. They’re your healthy core. The goal is to keep this segment as large as possible.
At Risk Members (Yellow)
This is where the magic happens. These members were active but haven’t engaged recently. They’re on the edge—still recoverable with the right intervention. A personal message, an interesting discussion topic, or a community event might bring them back. This is your action list.
Dormant Members (Orange)
Members who haven’t engaged in a while but haven’t completely disappeared. They might respond to a re-engagement campaign or a “we miss you” email. Worth the effort for larger communities.
Inactive Members (Red)
Members who registered but never really engaged, or who left long ago. Don’t waste resources here—focus on the At Risk and Dormant segments instead.
The visual health bar at the top shows you the distribution at a glance. If you see that yellow “At Risk” segment growing, you know something’s wrong and can investigate immediately—before it becomes a crisis.
Track Every Meaningful Interaction
The Overview Dashboard gives you a real-time snapshot of community activity. At a glance, you can see:
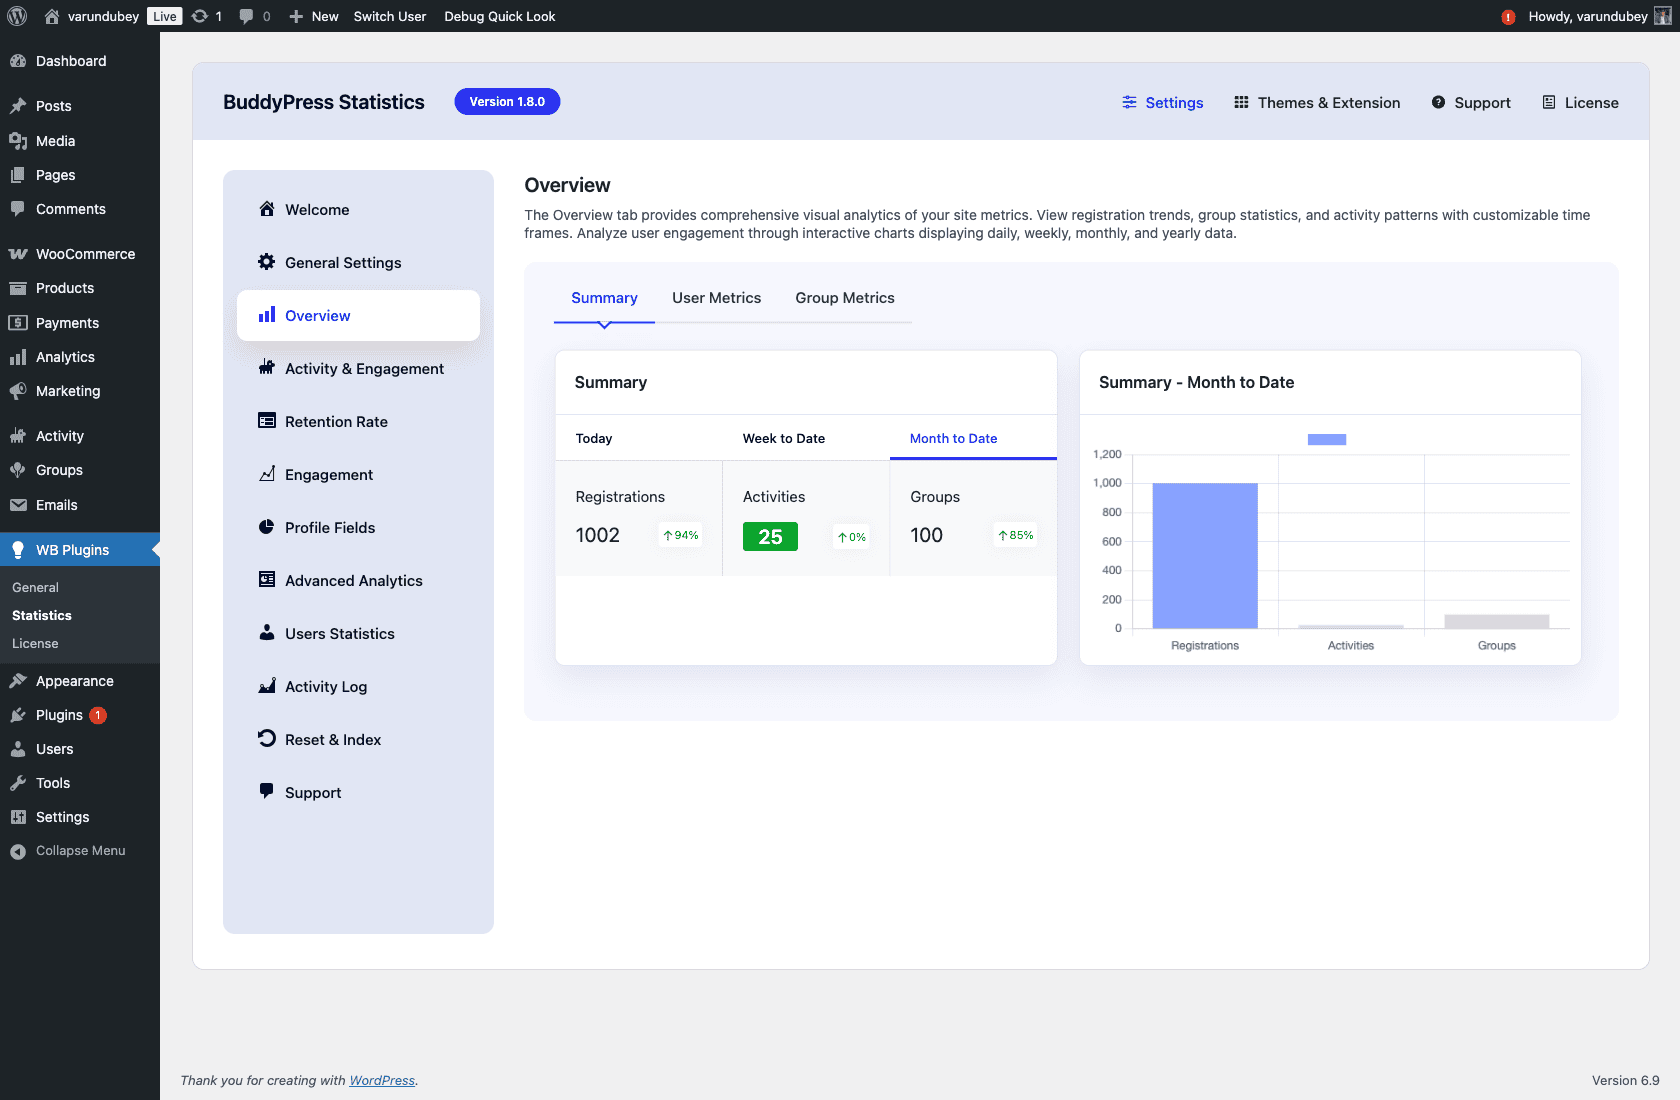
- Active Users – Daily, weekly, and monthly active user counts
- New Registrations – Track growth over time
- Activity Levels – Posts, comments, group joins, friendships
- Engagement Trends – Is activity increasing or declining?
The dashboard loads instantly thanks to the performance optimizations in v1.8.0 (more on that below). No more waiting for analytics to calculate—the data is ready when you are.
Understand Engagement Patterns
Numbers alone don’t tell the full story. You need to see patterns over time. The Activity & Engagement section provides visual graphs that reveal:

- Activity over time – See spikes and dips in engagement
- Filter by date range – Compare this month to last month, this quarter to last quarter
- Peak engagement times – Know when your community is most active
- Content type performance – Which activities generate the most engagement?
I use these graphs to plan community activities. If I see engagement dipping on Wednesdays, maybe that’s when I should post discussion questions. If weekends are dead, I won’t schedule important announcements then. Data drives decisions.
Identify Your Community Champions
Every community has power users—members who contribute disproportionately to activity and value. The Advanced Analytics section helps you identify and celebrate them:
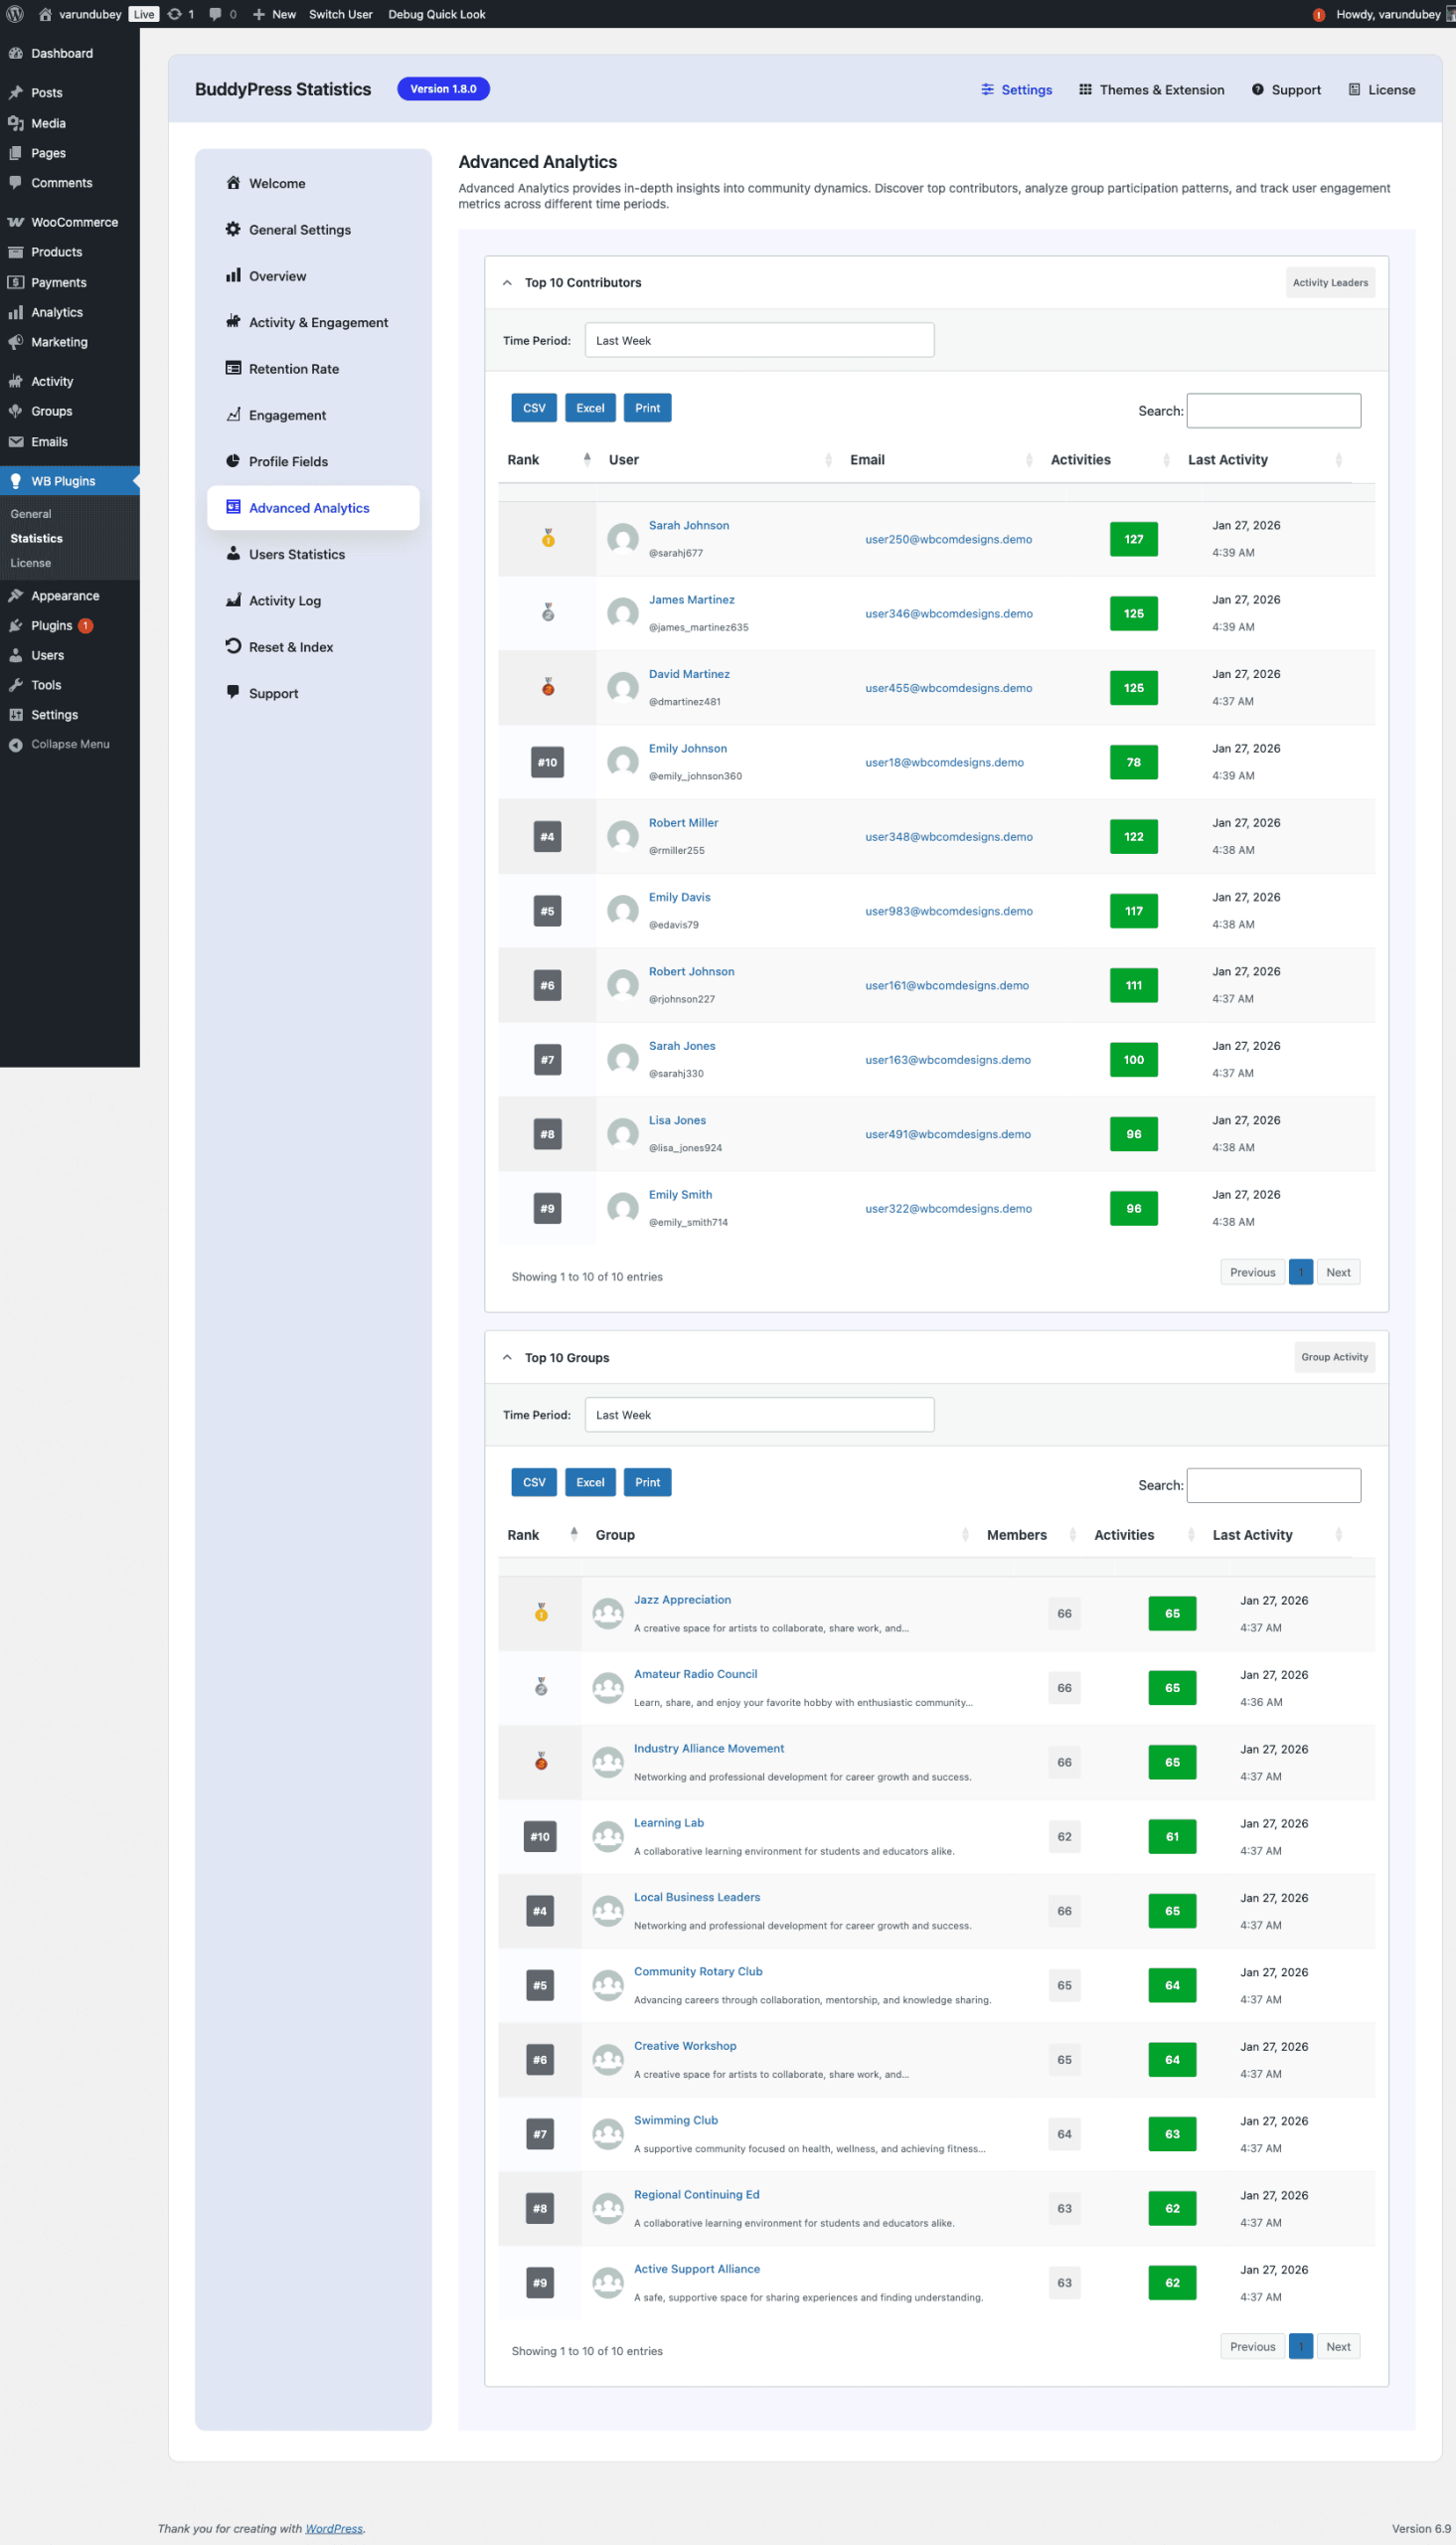
The Top Contributors leaderboard shows you who’s driving engagement. Use this data to:
- Recognize top contributors publicly in community announcements
- Reward engagement with badges, special access, or community roles
- Build a moderator team from naturally engaged members
- Create gamification programs based on actual contribution data
Your community champions are your most valuable asset. Don’t let their contributions go unnoticed. If you’re using BuddyPress Member Types to categorize your community, you can combine that segmentation with statistics to understand how different member types engage.
Complete Audit Trail with Activity Log
Sometimes you need to dig into the details. The Activity Log captures every significant action in your community:

- Every login tracked – See when members are accessing your site
- Content creation logged – Posts, comments, messages, group activities
- Social actions recorded – Friendships, group joins, follows
- Powerful filtering – Search by user, action type, date range
- CSV export – Take data into spreadsheets for deeper analysis
The activity log is also GDPR-compliant with IP anonymization options. You can track activity patterns without storing personally identifiable information if your jurisdiction requires it.
Empower Your Members with Frontend Statistics
BuddyPress Statistics isn’t just for admins. Members can see their own statistics on their profiles:
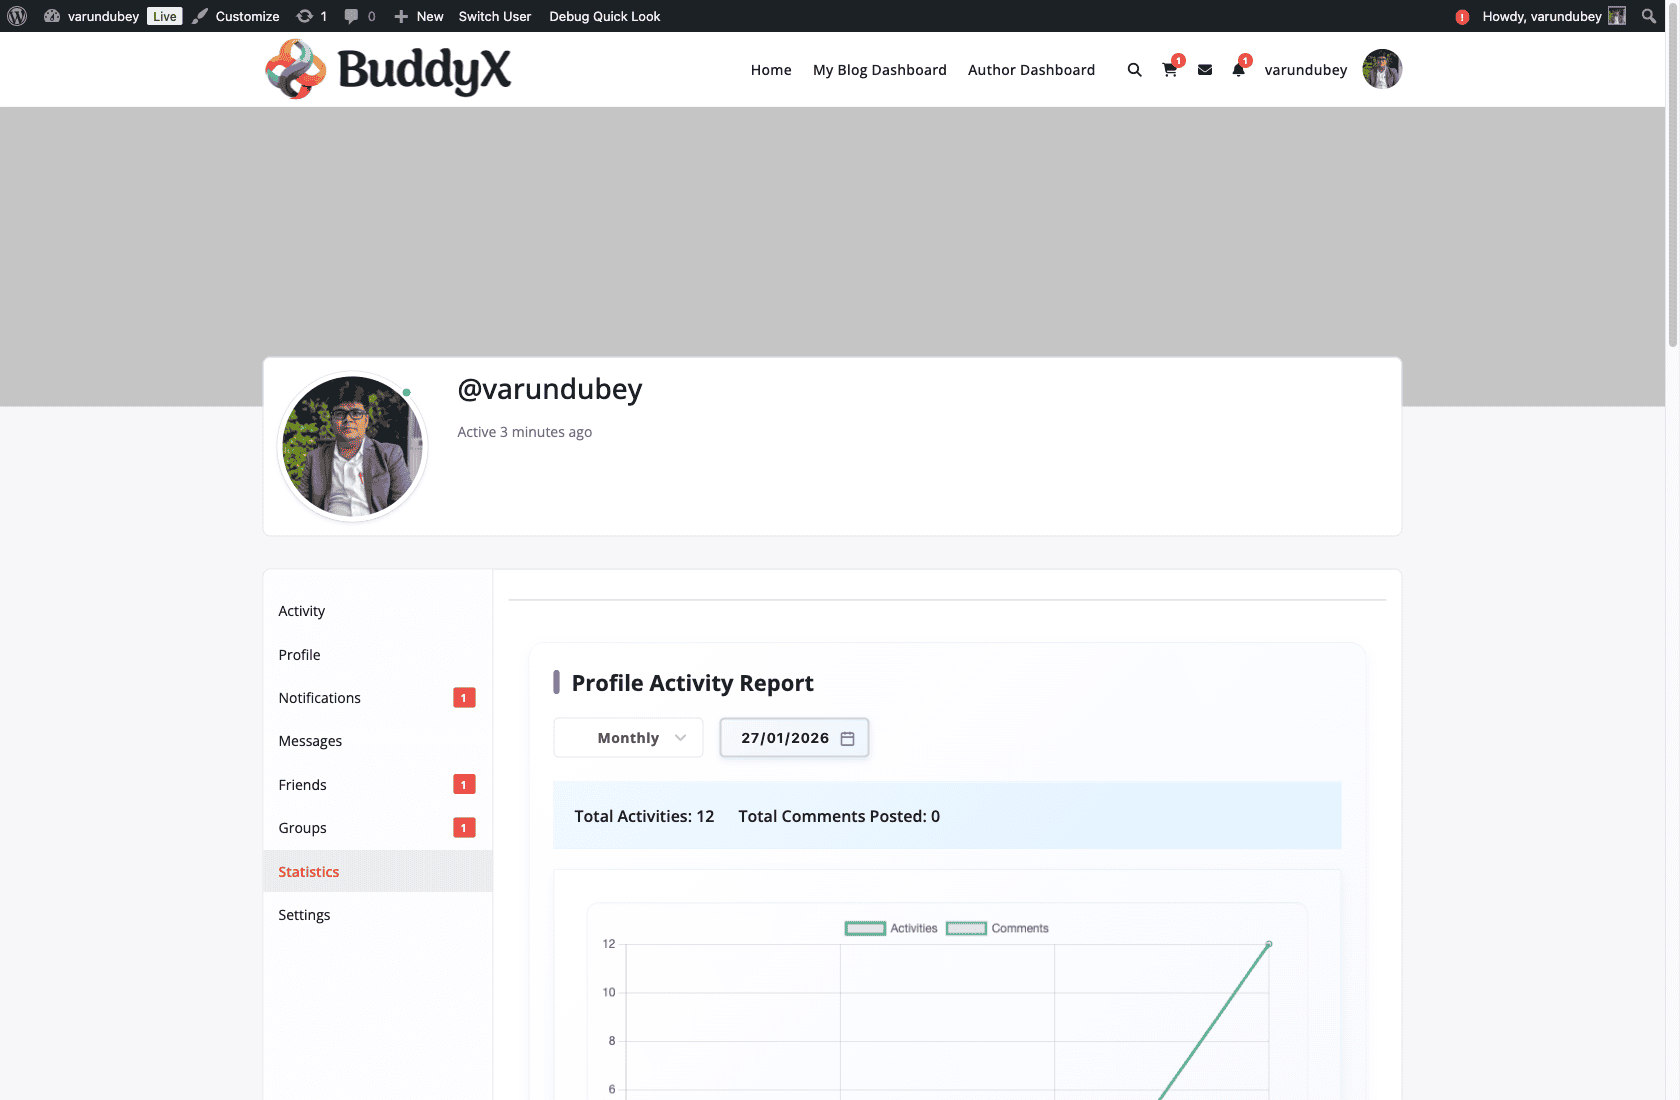
- Profile Statistics Tab – Members see their activity history
- Group Statistics – Group admins can view their group’s engagement
- Widgets – Display community stats in sidebars and widget areas
Transparency builds trust. When members can see their own contribution data, they feel more connected to the community. It also subtly gamifies engagement—people naturally want to see their numbers go up.
Why v1.8.0 is a Game Changer: Performance That Matters
Let me share something technical that has huge practical implications. Before v1.8.0, loading the activity log on a large community could generate over 10,000 database queries. Yes, you read that right. This “N+1 query problem” is a common performance killer in WordPress plugins.
In v1.8.0, I completely rewrote the data fetching logic. That same page now runs with approximately 15 queries total. The improvement is dramatic:
- Dashboard loads instantly – No more waiting for analytics
- Large communities supported – Scales to thousands of members
- Server resources freed – Less load means faster site overall
- Cache warming via WP-Cron – Data pre-calculated for instant display
Performance isn’t a feature—it’s the foundation that makes all features usable. A slow analytics dashboard is a dashboard nobody uses.
Security Hardened for Peace of Mind
Version 1.8.0 includes comprehensive security improvements:
- Fixed critical AJAX vulnerabilities with proper capability checks
- Hardened REST API endpoints with permission callbacks
- Plugin-specific nonces for AJAX requests
- Fixed potential object injection vulnerabilities
- Improved output escaping across all templates
- GDPR-compliant IP anonymization option
Your community data is sensitive. BuddyPress Statistics treats it that way.
Compatibility You Can Count On
BuddyPress Statistics v1.8.0 works with:
- BuddyPress 12+ – Full compatibility with the latest version
- BuddyBoss Platform – Seamlessly integrates with BuddyBoss themes and features
- Youzify – Compatible with Youzify’s profile customizations
- WordPress Multisite – Network-wide support
- PHP 7.0+ – Broad hosting compatibility
I test against these platforms continuously to ensure you never face compatibility issues after an update. For WordPress agencies managing multiple client sites, this reliability is essential.
The AI-Ready Foundation: What’s Coming Next
Version 1.8.0 lays the groundwork for exciting features on the roadmap:
AI-Powered Analytics Reports
Imagine receiving weekly summaries that explain what’s happening in your community, written in plain English. “Your At Risk segment grew 15% this week—here are the 10 members most likely to churn and suggested re-engagement actions.”
REST API for External Integrations
Connect your community data to external tools—CRM systems, email marketing platforms, custom dashboards. Your community data, accessible anywhere.
Predictive Retention Insights
Using historical data to predict which members are likely to become inactive, before they actually do. Proactive community management instead of reactive.
These features require the solid foundation of clean data, fast queries, and secure APIs. Version 1.8.0 provides that foundation.
Get Started Today
Stop guessing about your community. Start knowing.
BuddyPress Statistics v1.8.0 is available now. Whether you’re running a small membership site or a large BuddyBoss-powered community, you’ll finally have the insights you need to make informed decisions.
Resources:
Your community deserves to be understood. Now it can be.