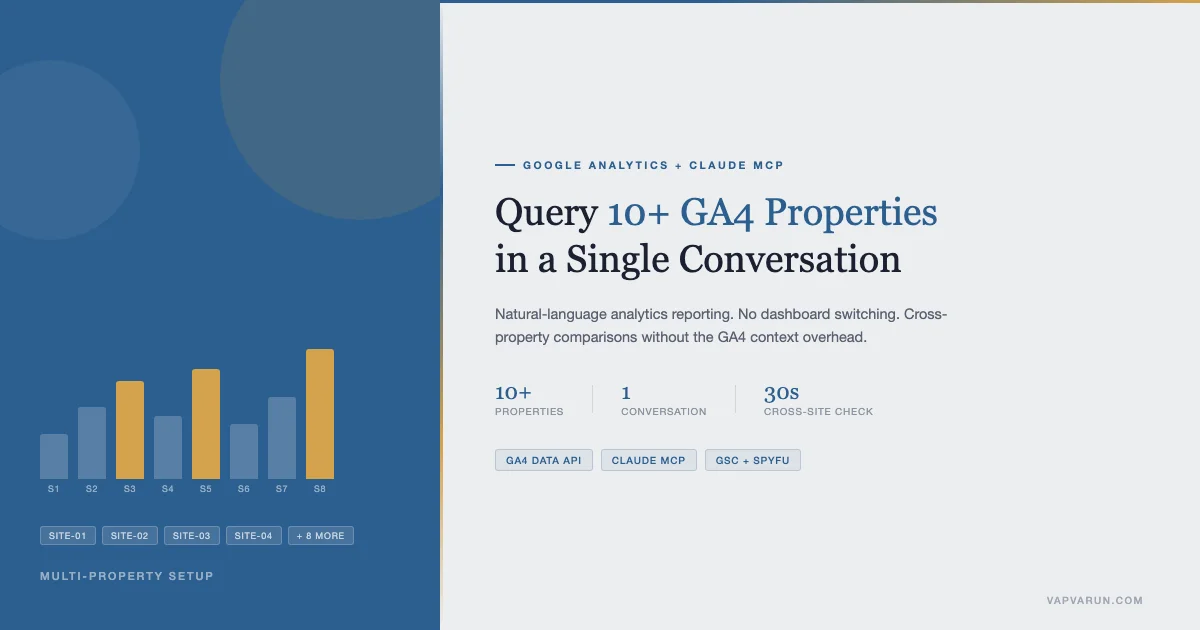
Google Analytics via Claude MCP: A Working Setup for Multi-Site Analytics
GA4’s reporting interface has a tax that nobody talks about: the time cost of switching contexts. If you manage analytics for ten or more properties (separate clients, separate sites, a mix of staging and production), you spend real minutes every day just navigating between properties, rebuilding date ranges, and re-selecting dimensions. That overhead compounds fast. The GA4 UI was designed for a single property at a time, and it shows.
What changes with an analytics MCP connected to Claude is the query model. Instead of navigating to the right property and building a report, you describe what you want to know. Claude calls the GA4 API on your behalf, pulls the data, and returns an answer in plain text. The same conversation thread can cover five properties without you changing a tab. This post documents a working setup that solves that specific pain: multi-site GA4 reporting without the dashboard gymnastics.
The Problem With GA4 for Multi-Property Operations
Google Analytics 4 is a significant improvement over Universal Analytics for event modeling and cross-device tracking. The reporting experience for anyone managing multiple properties is a different story.
The core issue is that GA4 has no native multi-property view. Every report is scoped to a single property. If you run an agency with 15 client properties, or a SaaS with a staging, preview, and production account, or a network of content sites under one roof, you repeat the same clicks across every property you need to check.
The GA4 Looker Studio connector partially addresses this with blended data sources, but it requires manual connector setup per property, the schema is fragile when Google updates the connector, and it still does not give you conversational querying. You define the reports in advance; you cannot ask follow-up questions.
The GA4 API solves the technical problem, it has full multi-property support and returns clean JSON, but requires code to use. Most agency operators and marketing ops people are not going to write Python scripts every time they want a quick answer. That gap is where Claude MCP fits.
What an MCP Server Actually Does Here
The Model Context Protocol (MCP) is a standard for connecting external tools and data sources to Claude. When you configure an MCP server and connect it to Claude, Claude can call that server’s tools as part of any conversation. The server handles the API authentication, request formatting, and response parsing. Claude handles the query intent and answer synthesis.
For analytics, this means the following pattern becomes possible:
- You ask Claude a question about your GA4 data in natural language
- Claude determines which GA4 API call to make (or which sequence of calls)
- The analytics MCP server executes the API call with your credentials
- Claude interprets the response and answers your question
The MCP server does not make Claude smarter about analytics. It gives Claude access to live data. Claude’s job is to map your question to the right API parameters and to explain what the data shows. The server’s job is to handle OAuth and return clean data.
This is a different architecture from a custom GPT or a chatbot trained on your data. There is no fine-tuning, no embeddings, no knowledge base. It is a direct API proxy with a natural-language query interface on top. That distinction matters for understanding the limits, which we will cover later.
The Analytics MCP Setup
What You Need
Before installation, confirm you have:
- A Google Cloud project with the GA4 Data API enabled
- A service account or OAuth 2.0 credentials for that project
- Viewer access on each GA4 property you want to query
- Claude Desktop or Claude Code with MCP support (Claude.ai browser does not support MCP at time of writing)
- Node.js 18+ installed
Installing the Server
The most maintained GA4 MCP implementation at time of writing is the @analytics-intelligence/ga4-mcp server, though the MCP ecosystem is moving quickly. The install pattern is the same regardless of which server you use.
Add the server to your MCP configuration. For Claude Desktop, this lives at ~/Library/Application Support/Claude/claude_desktop_config.json on macOS:
The config structure follows the standard MCP format: a server name, the command to run it, any arguments, and environment variables for credentials. If you are using a service account, the GOOGLE_APPLICATION_CREDENTIALS environment variable points to your JSON key file. If you are using OAuth, the credentials flow runs on first launch.
OAuth and Property Access
Service accounts are simpler to configure but require granting Viewer access on each GA4 property individually. If you are adding a new client property, you add the service account email to that property’s user management, the same way you would add any user.
The advantage of a service account over personal OAuth is that it does not expire. Personal OAuth tokens need reauthorization periodically. For an always-on setup where you query across properties daily, service accounts are the cleaner path.
For each property you want to query, the service account needs at minimum the Viewer role in GA4. No special API permissions beyond that are required. The GA4 Data API uses property-level access control, so the service account only sees what its role allows.
Property Linking
The MCP server discovers properties automatically if the service account has access to a Google Analytics account. Most servers also support explicit property lists in the config, which is worth doing for multi-property setups. Explicit property lists give you cleaner tool descriptions and prevent Claude from accidentally querying the wrong property when names are similar.
A typical multi-property config section looks like this:
Naming convention matters here. Use names that are unambiguous in natural language. “Client A” is not a useful property name when you are asking Claude about “organic traffic for the client we migrated last month.” Use the actual site domain or a memorable short name.
The Queries That Pay Off
Once the server is connected and properties are listed, the most valuable queries tend to cluster around a few operational patterns. These are not fancy analyses. They are the reports you were already pulling manually, now without the navigation overhead.
Top Organic Pages
The most immediate time-saver. A single question replaces three or four GA4 navigation steps per property:
“What are the highest-traffic pages by organic search sessions for [property name] over the last 30 days? Show me the sessions, avg engagement rate, and conversions for each.”
Claude calls the GA4 Data API with the sessionDefaultChannelGroup dimension set to “Organic Search”, adds the page path and title dimensions, and returns the report. The engagement rate and conversion columns require specifying your conversion event names. If you have not set those up in GA4, Claude will either return zeros or ask you to clarify.
For the multi-property use case, you can ask this across several properties in a single message. Claude will make sequential API calls and present the results per property. It is not instantaneous, each API call takes a moment, but the total time is far less than clicking through each property.
Channel Comparison
Channel mix shifts are often the first indicator of something worth investigating: an organic drop, a paid campaign starting to show impact, or a referral source picking up. The GA4 UI requires a traffic acquisition report per property. Via MCP:
“Compare channel performance for [property name] this month versus last month. I want sessions, engaged sessions, and goal completions by default channel group.”
This query benefits from Claude’s ability to interpret comparisons. It does not just return two tables. If organic dropped 18% and direct increased 22%, Claude will flag that in the summary. That interpretation step is where the MCP setup returns more value than a Looker Studio report that would show the same numbers without the annotation.
Conversion Funnel by Property
GA4’s funnel exploration tool requires building the funnel inside the UI per property. For a standardized funnel (landing page to contact form to thank-you page, or product page to add-to-cart to checkout), you can describe the funnel to Claude and get step-completion rates without touching the GA4 interface:
“For [property name], show me the funnel from the /services/ page to /contact/ to /thank-you/, how many sessions entered at each step and what was the drop-off rate between steps?”
GA4’s funnel API endpoint is separate from the standard Data API. Not all MCP server implementations expose it. If yours does not, Claude will tell you the tool is unavailable and suggest a workaround using event sequences. Worth checking before relying on funnel queries in production.
New vs Returning Users by Acquisition Source
A useful operational check for content sites. Which channels bring readers who come back, versus one-and-done visits? The query pattern:
“For [property], break down sessions by new vs returning users, segmented by default channel group, for the last 60 days.”
GA4 has the newVsReturning dimension in the user segment section. Claude knows to use this. The insight, social traffic brings new users, email brings returning users, organic brings a mix, is a common one, but seeing it per property and per month is genuinely useful for content planning.
Cross-Property Reporting
The most practical use case for a multi-site operator is running the same analysis across all properties in a single Claude conversation. The setup does not require any special configuration beyond having all properties accessible to the service account.
A real-world pattern: start a new Claude conversation, establish context, then run a sweep:
“For each of the following properties, [list names], give me the organic session count for this week versus the same week last year. Flag any property that shows more than a 15% decline.”
Claude will work through the properties sequentially, make one API call per property, and compile the comparison. With 10 properties this takes roughly 30-60 seconds. The output is a concise table followed by any flagged anomalies. That same check, done manually in GA4, would take 15-20 minutes of clicking.
A few patterns that work well for cross-property reporting:
- Weekly organic health check: highest 5 pages by sessions for each property, flagging drops vs prior period
- Campaign spread check: sessions from a specific UTM campaign across all properties, useful for network-wide newsletter sends or PR coverage
- Conversion rate parity: compare goal completion rates across similar sites to find underperformers that need CRO attention
- Content gap by property: which properties have strong organic traffic but no conversion events, i.e., good top-of-funnel but no call to action on the landing pages
Cross-property analysis works cleanly when properties are structurally similar. If one property uses custom event names and another uses GA4 recommended events for the same conversion, Claude will flag the inconsistency. That flag is actually useful: it surfaces measurement discrepancies you might not have caught otherwise.
The patterns described here connect directly to the content planning workflow I use with the full MCP stack, where GA4 data feeds into the weekly editorial calendar decisions. More on that at the end.

Limits and Gotchas
An honest assessment: the GA4 MCP setup is genuinely useful, and it has real constraints that matter in production use.
API Quotas
The GA4 Data API has quota limits. The default limits for the standard API are:
- 200 requests per day per project per property (for reporting queries)
- Burst limits that apply when you make many requests in quick succession
For a 10-property cross-property sweep at daily cadence, you will hit these limits quickly if you are not careful. The practical mitigation is to batch your queries. Instead of one question per property, group properties in a single ask. The MCP server handles this more efficiently than ten separate calls.
If you need higher quota, you can request an increase through Google Cloud Console. For most agency operators running one daily sweep across 10-15 properties, the default quota is sufficient if queries are well-formed.
Data Sampling
GA4 samples data on property-level queries above certain volume thresholds. This is the same sampling issue that existed in Universal Analytics. Claude cannot override this. If a property has high traffic and your query spans a long date range, GA4 returns sampled data. Claude will surface the sampling warning from the API response if it is present.
For reporting purposes this is usually fine. For precise conversion tracking where every session counts, use the GA4 UI’s unsampled exports or BigQuery export instead of the Data API for those specific queries.
Dimension and Metric Incompatibility Errors
The GA4 Data API enforces strict rules about which dimensions and metrics can be combined in a single query. Some combinations are invalid, GA4 will return a 400 error with a message explaining the incompatibility. Claude handles most of these gracefully by either reformulating the query or explaining the constraint.
The most common incompatibility you will encounter: mixing user-scoped dimensions with session-scoped metrics. For example, combining userLtv (a user-scoped dimension) with sessions (a session-scoped metric) is not allowed. If Claude returns an error on a query that seems reasonable, the dimension/metric scope mismatch is usually the cause. Ask Claude to reformulate using only session-scoped dimensions, and the query will work.
Freshness and Real-Time Data
The GA4 Data API is not real-time. Standard reporting has a data freshness lag of 24-48 hours for most properties, though some metrics update faster. The GA4 Realtime API is a separate endpoint, and most MCP server implementations either do not expose it or expose it with limited dimensions.
For operational dashboards where you need to see today’s data, the GA4 UI is still the right tool. For analysis, trend detection, and content planning, where yesterday’s data is sufficient, the MCP setup works without any freshness issues.
Custom Definitions and Events
Claude does not automatically know your custom event names, custom dimensions, or conversion events. You either include them in your MCP server config (some servers support a property metadata section) or you tell Claude in the conversation context. Building a short context block at the start of a new conversation session, “On [property name], conversions are tracked as the ‘form_submit’ event, custom dimension ‘client_tier’ is set on all page views”, makes queries significantly more accurate.
When to Use Claude MCP vs Looker Studio vs Raw GA4
These three tools serve different needs and are not substitutes for each other. Here is a working framework for when each one is the right choice.
| Use Case | Right Tool | Reason |
|---|---|---|
| Daily multi-property health check | Claude MCP | Fastest for cross-property queries, no navigation overhead |
| Repeatable client-facing report | Looker Studio | Shareable, schedulable, branded, no AI dependency |
| Deep funnel or cohort analysis | GA4 UI | Exploration tools, segments, and funnel builder are purpose-built |
| Ad-hoc anomaly investigation | Claude MCP | Conversational follow-up queries make root-cause investigation faster |
| High-volume unsampled export | BigQuery + GA4 | API quota and sampling constraints make Data API unsuitable |
| Non-technical stakeholder reporting | Looker Studio | No text output, visual format, no AI interpretation required |
| Content planning decisions | Claude MCP + GSC MCP | Combining GA4 + GSC data in one conversation is the strongest signal |
The practical split for most agency operations: Looker Studio for recurring client deliverables, Claude MCP for internal analysis and planning, GA4 UI for deep investigations that need the exploration tools. These coexist cleanly. They use different access patterns and serve different audiences.
Where the MCP setup genuinely changes behavior is in the analysis cadence. When querying is fast and conversational, you run more checks. You ask follow-up questions. You investigate anomalies that you might have deferred when pulling the report required ten manual steps. That behavioral shift (lower friction means more analysis) is the real return on setting this up.
The Full Stack: GA MCP + GSC MCP + SpyFu MCP
GA4 answers the “what is happening now” question: which pages get traffic, from which channels, and whether visitors convert. It does not answer “why is this happening” or “what should we write next.” For those questions, you need two more data sources.
The Google Search Console MCP gives you the search side: which queries trigger impressions, which have high impressions but low clicks (weak title or meta), which pages sit at positions 5-15 where a content update could move them to page one. GSC data is distinct from GA4, it shows pre-click behavior where GA4 shows post-click behavior. Together they close the attribution loop from search intent to site behavior to conversion.
The SpyFu MCP adds competitive keyword data: what queries your competitors rank for that you do not, keyword difficulty estimates, and search volume for candidate topics. SpyFu fills the gap that neither GA4 nor GSC covers, the opportunity space you have not yet entered.
When all three are connected to Claude, a content planning session looks like this:
- GA4 MCP: which pages have strong traffic but low conversion (content needs a CTA or a deeper hook)
- GSC MCP: which queries have high impressions at positions 5-20 (pages worth updating for a ranking push)
- SpyFu MCP: which competitor topics are in your keyword territory but not yet covered (gaps to fill)
That three-source analysis, done manually, takes a couple of hours of context-switching. In a single Claude conversation with all three MCPs connected, it takes 15-20 minutes and produces a prioritized content action list.
I wrote about the full content planning workflow in more detail in the post on AI for agency lead generation using Claude, SpyFu, and GSC. The setup described there uses the same MCP architecture and adds the sales funnel dimension to the same data sources.
The architecture of building and maintaining these MCP servers is documented in the post on MCP servers for WordPress and how they change plugin development workflows, useful context if you are considering building a custom connector for a data source that does not have a public MCP server yet.
Implementation Notes for a Production Setup
A few operational details worth noting if you are setting this up for real work rather than experimentation.
Separate Service Accounts per Environment
Use a dedicated service account for MCP access rather than your personal Google account credentials. This keeps your personal account out of any MCP configuration file, limits the blast radius if credentials are exposed, and makes it easier to rotate keys without affecting other integrations.
If you manage both production and staging properties for clients, consider a service account per client. It makes property access management cleaner as clients onboard and offboard.
MCP Config Version Control
Your MCP config file contains property IDs and potentially credential paths. Put it in version control (without the actual credential JSON files). The config itself (which properties are mapped to which names, which MCPs are configured) is operational knowledge that should not live only on your local machine.
Prompt Templates for Recurring Reports
The most time-saving move once the setup is running: build a small library of prompts for your most common queries. Store them as text files or in a notes app. A weekly organic health check prompt that you copy-paste into a new Claude conversation takes 30 seconds. Building that prompt from scratch each week takes three minutes and produces inconsistent queries. Consistent queries make week-over-week comparisons more reliable.
Cost Considerations
Claude API calls are not free. If you are running Claude Desktop with an Anthropic API key rather than a subscription, multi-property analysis sessions can add up. A typical 10-property weekly review session with follow-up questions runs roughly 50,000-80,000 tokens. At Claude Sonnet pricing, that is a few cents. At Opus pricing, it is more. Factor this in if you are running this at scale or billing clients for your time.
Claude subscriptions (Pro, Teams) include MCP support and do not charge per token. For operators running analysis daily, a subscription is more predictable than pay-per-token.
What This Setup Is Not
A realistic assessment matters here. The GA4 MCP setup is not a replacement for a dedicated analytics platform. It does not give you time-series visualizations, does not have saved dashboards, does not support alerts or anomaly detection, and does not have a shareable interface for non-technical stakeholders.
It is a query interface. The value is in the speed and conversational nature of the queries, and in the cross-property capability. For operators who already know what questions to ask and need fast answers, it is genuinely useful. For operators who need analytics to surface problems proactively or to share reports with clients, it is a complement to other tools, not a replacement.
The MCP ecosystem is also evolving fast. Server implementations that exist today may be updated, deprecated, or superseded by better options within a year. The setup described here is a working pattern, not a permanent infrastructure decision. Build your workflows around the queries and the access pattern, not around any specific server implementation.
Getting Started
The practical path if you want to test this without committing to a full setup:
- Pick one GA4 property to start (not your most critical one)
- Create a Google Cloud project, enable the GA4 Data API, create a service account
- Grant the service account Viewer access on that one property
- Configure the MCP server in Claude Desktop with that one property
- Run five queries you currently pull manually from GA4
- Note how much time you saved and whether the output quality meets your needs
If those five queries are useful, add the rest of your properties. If they are not, you have spent about two hours and learned something concrete about where MCP analytics fits in your stack.
The technology is not the hard part. The operational questions, which queries are worth standardizing, which properties need cross-property analysis, whether the sampling and quota limits are acceptable for your use case, take more time to answer than the installation. Answer those first, then set up the infrastructure.
Wbcom Designs works on integrations like this as part of the AI tooling work we do for WordPress agencies. If you are building a multi-site analytics workflow and want a custom MCP integration that goes beyond the standard GA4 server, property-specific event taxonomies, custom dimension mapping, or integrating analytics data with your CRM or content calendar, the work is scoped per project. See the MCP server development service or reach out directly.